I’m running several Amazon Lightsail instances as WordPress servers, which has been very successful, however I have been unable to monitor them effectively – until now.
Lightsail is the easiest of the AWS server products to setup and manage. A new WordPress server can be created in just a few minutes with only a few mouse clicks. And for a set monthly charge which gives predictable costs, making it very business friendly.
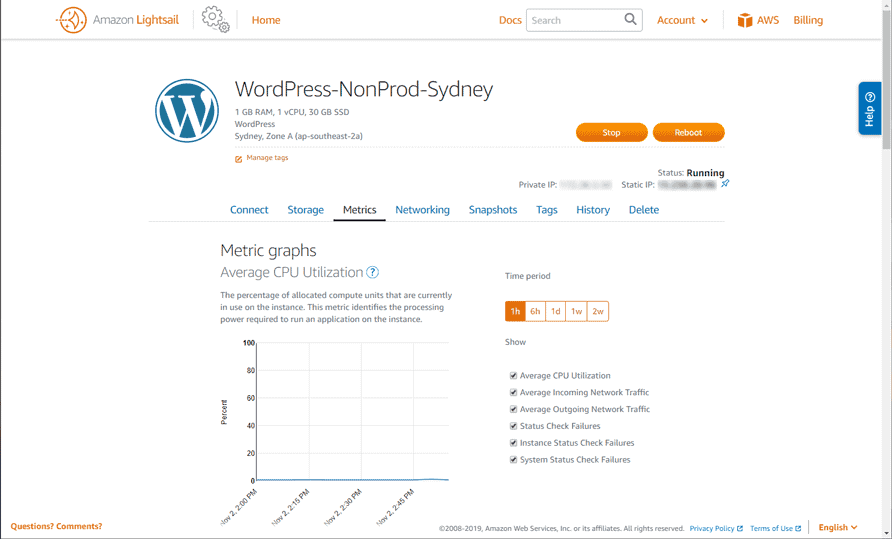
The biggest ‘gap’ in the Lightsail capabilities for me was the lack of monitoring. While there are metrics shown within the Lightsail console, these do not include Memory Utilization, and there is no way of triggering actions based on thresholds – there is only a graph for display when logged on.

While this is adequate (ie better than nothing); AWS includes the very capable CloudWatch product that has everything you could want to monitor your virtual infrastructure. The problem was that when I first researched using CloudWatch with Lightsail I found either:
1) “It can’t be done”, or
2) “I tried … and it didn’t work”
This is where things stood until I found this very useful article by Cal Henderson
https://www.iamcal.com/lightsail-cloudwatch
There is further background here:
https://stackoverflow.com/questions/41645642/can-i-use-aws-lightsail-with-aws-cloudwatch
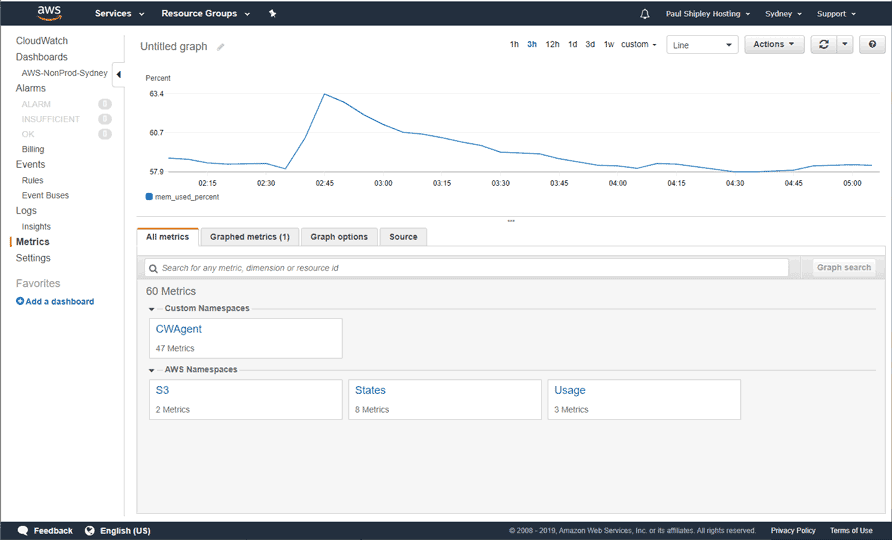
Following these instructions I soon had my Lightsail metrics in CloudWatch. For more details please read Cal’s article.
Set up an IAM user
In the AWS Console, create an IAM user to send metrics to Lightsail.
Be sure to record the access key and secret before leaving the console because you only get one chance to do this and if you lose them you will have to create new ones.
Install the CloudWatch Agent
wget https://s3.amazonaws.com/amazoncloudwatch-agent/ubuntu/amd64/latest/amazon-cloudwatch-agent.deb
sudo dpkg -i -E ./amazon-cloudwatch-agent.deb
sudo apt update
sudo apt upgrade
Setup credentials
You will need to create two configuration files for the root user. Replace the ‘region’, ‘aws_access_key_id’, and ‘aws_secret_access_key’ with your own values.
sudo mkdir /root/.aws

sudo nano /root/.aws/config

[profile AmazonCloudWatchAgent]
region = ap-southeast-2

^X and Save

sudo nano /root/.aws/credentials

[AmazonCloudWatchAgent]
aws_access_key_id=AKIA........
aws_secret_access_key=........

^X and Save
Generate your configuration file
Run the wizard to generate the config file for the metrics you want to collect. In most cases you will want to accept the default value. Be sure to select the ‘On Premises’ option for Lightsail. Do not store the config in the SSM parameter store. If you make a mistake or the config is not what you want, just start again.
sudo /opt/aws/amazon-cloudwatch-agent/bin/amazon-cloudwatch-agent-config-wizard
The config file will be in /opt/aws/amazon-cloudwatch-agent/bin/config.json which will be used later.
Fix the broken default config
sudo nano /opt/aws/amazon-cloudwatch-agent/etc/common-config.toml

[credentials]
    shared_credential_profile = "AmazonCloudWatchAgent"
    shared_credential_file = "/root/.aws/credentials"

 ^X and Save

sudo mkdir -p /usr/share/collectd/
sudo touch /usr/share/collectd/types.db
Start the agent
sudo /opt/aws/amazon-cloudwatch-agent/bin/amazon-cloudwatch-agent-ctl -a fetch-config -m onPremise \
	-c file:/opt/aws/amazon-cloudwatch-agent/bin/config.json -s
You should see some success messages and the logs are in /opt/aws/amazon-cloudwatch-agent/logs/
Wait several minutes then check the CloudWatch Dashboard at https://console.aws.amazon.com/cloudwatch/home
Navigate to the Metrics section and you should see a “CWAgent” section under “Custom Namespaces”.

You can now create some graphs, add them to dashboards, and create actions.
Check the status of the agent with
/opt/aws/amazon-cloudwatch-agent/bin/amazon-cloudwatch-agent-ctl -m onPremise -a status
Restart the agent with
sudo service amazon-cloudwatch-agent restart
